scatterChart
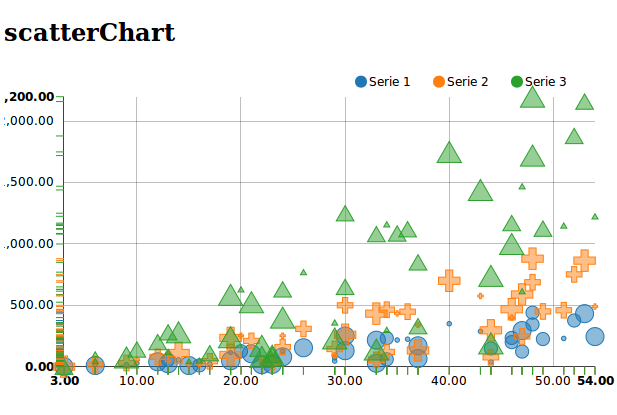
A scatter plot or scattergraph is a type of mathematical diagram using Cartesian coordinates to display values for two variables for a set of data. The data is displayed as a collection of points, each having the value of one variable determining the position on the horizontal axis and the value of the other variable determining the position on the vertical axis.
Django example:
from django.shortcuts import render_to_response
import random
import datetime
import time

def demo_scatterchart(request):
    """
    scatterchart page
    """
    nb_element = 50
    xdata = [i + random.randint(1, 10) for i in range(nb_element)]
    ydata1 = [i * random.randint(1, 10) for i in range(nb_element)]
    ydata2 = map(lambda x: x * 2, ydata1)
    ydata3 = map(lambda x: x * 5, ydata1)

    kwargs1 = {'shape': 'circle'}
    kwargs2 = {'shape': 'cross'}
    kwargs3 = {'shape': 'triangle-up'}

    extra_serie1 = {"tooltip": {"y_start": "", "y_end": " balls"}}

    chartdata = {
        'x': xdata,
        'name1': 'series 1', 'y1': ydata1, 'kwargs1': kwargs1, 'extra1': extra_serie1,
        'name2': 'series 2', 'y2': ydata2, 'kwargs2': kwargs2, 'extra2': extra_serie1,
        'name3': 'series 3', 'y3': ydata3, 'kwargs3': kwargs3, 'extra3': extra_serie1
    }
    charttype = "scatterChart"
    data = {
        'charttype': charttype,
        'chartdata': chartdata,
    }
    return render_to_response('scatterchart.html', data)
Template example:
{% load static %}
<link media="all" href="{% static 'nvd3/src/nv.d3.css' %}" type="text/css" rel="stylesheet" />
<script type="text/javascript" src='{% static 'd3/d3.min.js' %}'></script>
<script type="text/javascript" src='{% static 'nvd3/nv.d3.min.js' %}'></script>

{% load nvd3_tags %}
<head>
    {% load_chart charttype chartdata "scatterchart_container" %}
</head>
<body>
    {% include_container "scatterchart_container" 400 600 %}
</body>