Introduction
| Version: | 0.9.7 |
|---|---|
| Date: | Nov 17, 2017 |
| Keywords: | django, python, plot, graph, nvd3, d3 |
| Author: | Arezqui Belaid |
| License: | MIT |
| Description: | Python wrapper for nvd3, build re-usable charts and chart components for d3.js |
| NVD3: | NVD3 http://nvd3.org/ |
–
Django-nvd3 is a Django wrapper for NVD3 graph library. NVD3 is an attempt to build re-usable charts and chart components for d3.js without taking away the power that d3.js gives you.
Overview
Django-nvd3 is a Django wrapper for NVD3 graph library. Visit NVD3 website for futher information : http://nvd3.org/
Installation
Install, upgrade and uninstall django-nvd3.py with these commands:
$ pip install django-nvd3
$ pip install --upgrade django-nvd3
$ pip uninstall django-nvd3
Dependencies
Django-nvd3 have one major dependencie:
- python-nvd3 : https://github.com/areski/python-nvd3
Bower will be used to install D3 and NvD3, see bower website for futher info : http://bower.io/
Bower depends on Node and npm. It’s installed globally using npm:
npm install -g bower
To easy the integration with Django we will advice you to use django-bower.
For instance to run our demo project, you will install the dependencies from requirements.txt and then install django-bower. Django-bower is not a mandatory dependencies as the user should be free to install JS files using different method.
To install django-bower:
$ pip install django-bower
Read the documentation about Django-bower to find out how to configure it properly for your project: https://github.com/nvbn/django-bower
Then in the demo project directory just type the following:
$ python manage.py bower_install
$ python manage.py collectstatic
This will create a directory “components” where d3 & nvd3 will be installed.
You can see example settings file in demoproject.
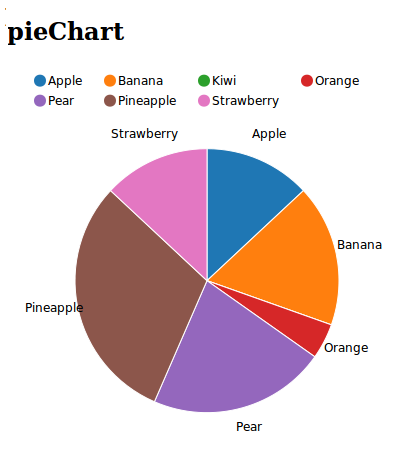
Example how to create a pieChart
Let’s say we have a simple view in which we want to display the amount of calories per fruit.
So to achieve this, we will edit our view.py, we will prepare the data that will be displayed:
xdata = ["Apple", "Apricot", "Avocado", "Banana", "Boysenberries", "Blueberries", "Dates", "Grapefruit", "Kiwi", "Lemon"]
ydata = [52, 48, 160, 94, 75, 71, 490, 82, 46, 17]
chartdata = {'x': xdata, 'y': ydata}
charttype = "pieChart"
chartcontainer = 'piechart_container'
data = {
    'charttype': charttype,
    'chartdata': chartdata,
    'chartcontainer': chartcontainer,
    'extra': {
        'x_is_date': False,
        'x_axis_format': '',
        'tag_script_js': True,
        'jquery_on_ready': False,
    }
}
return render_to_response('piechart.html', data)
We will render the template ‘piechart.html’ with a dictionary ‘data’ which contains ‘charttype’ and ‘chartdata’. ‘extra’ will contains a list of additional settings:
* ``x_is_date`` - if enabled the x-axis will be display as date format
* ``x_axis_format`` - set the x-axis date format, ie. "%d %b %Y"
* ``tag_script_js`` - if enabled it will add the javascript tag '<script>'
* ``jquery_on_ready`` - if enabled it will load the javascript only when page is loaded
    this will use jquery library, so make sure to add jquery to the template.
* ``color_category`` - Define color category (eg. category10, category20, category20c)
Our template piechart.html could look like this:
{% load nvd3_tags %}
<head>
    {% include_chart_jscss %}
    {% load_chart charttype chartdata chartcontainer extra %}
</head>
<body>
    <h1>Fruits vs Calories</h1>
    {% include_container chartcontainer 400 600 %}
</body>
We use include the Javascript and CSS code for D3/NVD3. We start preparing and display the javascript code needed to render our pieChart:
{% load_chart charttype chartdata "piechart_container" extra %}
Finally we create a div container which will be used to display the chart.
See the demo project in directory ‘demoproject’ for examples of django-nvd3 usage.
Live demo of NVD3
See a live demo on jsfiddle : http://jsfiddle.net/areski/z4zuH/246/
Projects using Django-nvd3
- CDR-Stats : http://www.cdr-stats.org
- Newfies-Dialer : http://www.newfies-dialer.org
Documentation
Documentation is available on ‘Read the Docs’: http://django-nvd3.readthedocs.org
Changelog
Changelog summary : https://github.com/areski/django-nvd3/blob/master/CHANGELOG.rst
Contributing
If you’ve found a bug, add a feature or improve django-nvd3 and think it is useful then please consider contributing. Patches, pull requests or just suggestions are always welcome!
Source code: http://github.com/areski/django-nvd3
If you don’t like Github and Git you’re welcome to send regular patches.
Bug tracker: http://github.com/areski/django-nvd3/issues
License
Copyright (c) 2013-2014 Arezqui Belaid <areski@gmail.com>
Django-nvd3 is licensed under MIT, see MIT-LICENSE.txt.