linePlusBarChart
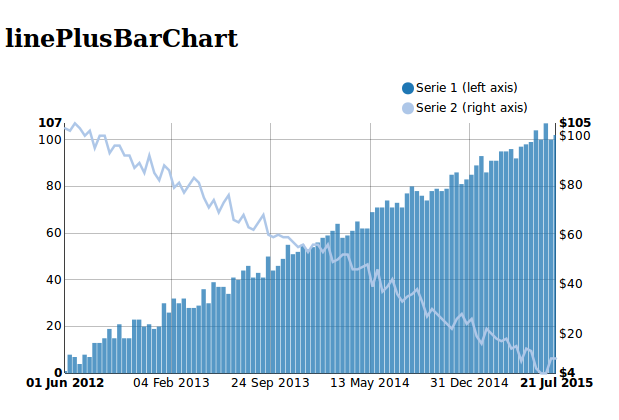
A linePlusBarChart Chart is a type of chart which displays information as a series of data points connected by straight line segments and with some series with rectangular bars with lengths proportional to the values that they represent
Django example:
from django.shortcuts import render_to_response
import random
import datetime
import time

def demo_lineplusbarchart(request):
    """
    lineplusbarchart page
    """
    start_time = int(time.mktime(datetime.datetime(2012, 6, 1).timetuple()) * 1000)
    nb_element = 100
    xdata = range(nb_element)
    xdata = map(lambda x: start_time + x * 1000000000, xdata)
    ydata = [i + random.randint(1, 10) for i in range(nb_element)]
    ydata2 = [i + random.randint(1, 10) for i in reversed(range(nb_element))]

    kwargs1 = {}
    kwargs1['bar'] = True

    tooltip_date = "%d %b %Y %H:%M:%S %p"
    extra_serie1 = {"tooltip": {"y_start": "$ ", "y_end": ""},
                    "date_format": tooltip_date}
    extra_serie2 = {"tooltip": {"y_start": "", "y_end": " min"},
                    "date_format": tooltip_date}

    chartdata = {
        'x': xdata,
        'name1': 'series 1', 'y1': ydata, 'extra1': extra_serie1, 'kwargs1': kwargs1,
        'name2': 'series 2', 'y2': ydata2, 'extra2': extra_serie2,
    }

    charttype = "linePlusBarChart"
    data = {
        'charttype': charttype,
        'chartdata': chartdata,
        'extra': {
            'focus_enable': True,
        },
    }
    return render_to_response('lineplusbarchart.html', data)
Template example:
{% load static %}
<link media="all" href="{% static 'nvd3/src/nv.d3.css' %}" type="text/css" rel="stylesheet" />
<script type="text/javascript" src='{% static 'd3/d3.min.js' %}'></script>
<script type="text/javascript" src='{% static 'nvd3/nv.d3.min.js' %}'></script>

{% load nvd3_tags %}
<head>
    {% load_chart charttype chartdata "lineplusbarchart_container" True "%d %b %Y %H" %}
</head>
<body>
    {% include_container "lineplusbarchart_container" 400 600 %}
</body>
</body>